RF Reflectometry Measurements of Quantum Dots
Introduction
Characterizing semiconductor spin qubits with radio-frequency (RF) reflectometry offers a speed advantage over low-frequency conductance measurements thanks to insensitivity to 1/f noise. In this blog post, the measurements of Josip Kukučka and his colleagues working in the Nanoelectronics group at IST Austria are discussed. You will learn how to perform RF reflectometry with the UHFLI Lock-in Amplifier to measure the Coulomb blockade diamonds of a semiconductor nanostructure. With the large frequency range and measurement bandwidth of the UHFLI, the technique is realized in an all-digital approach supporting multi-frequency operation. This opens up possibilities for fast readout techniques exploiting coupling to multiple gate electrodes.
Coulomb Blockade
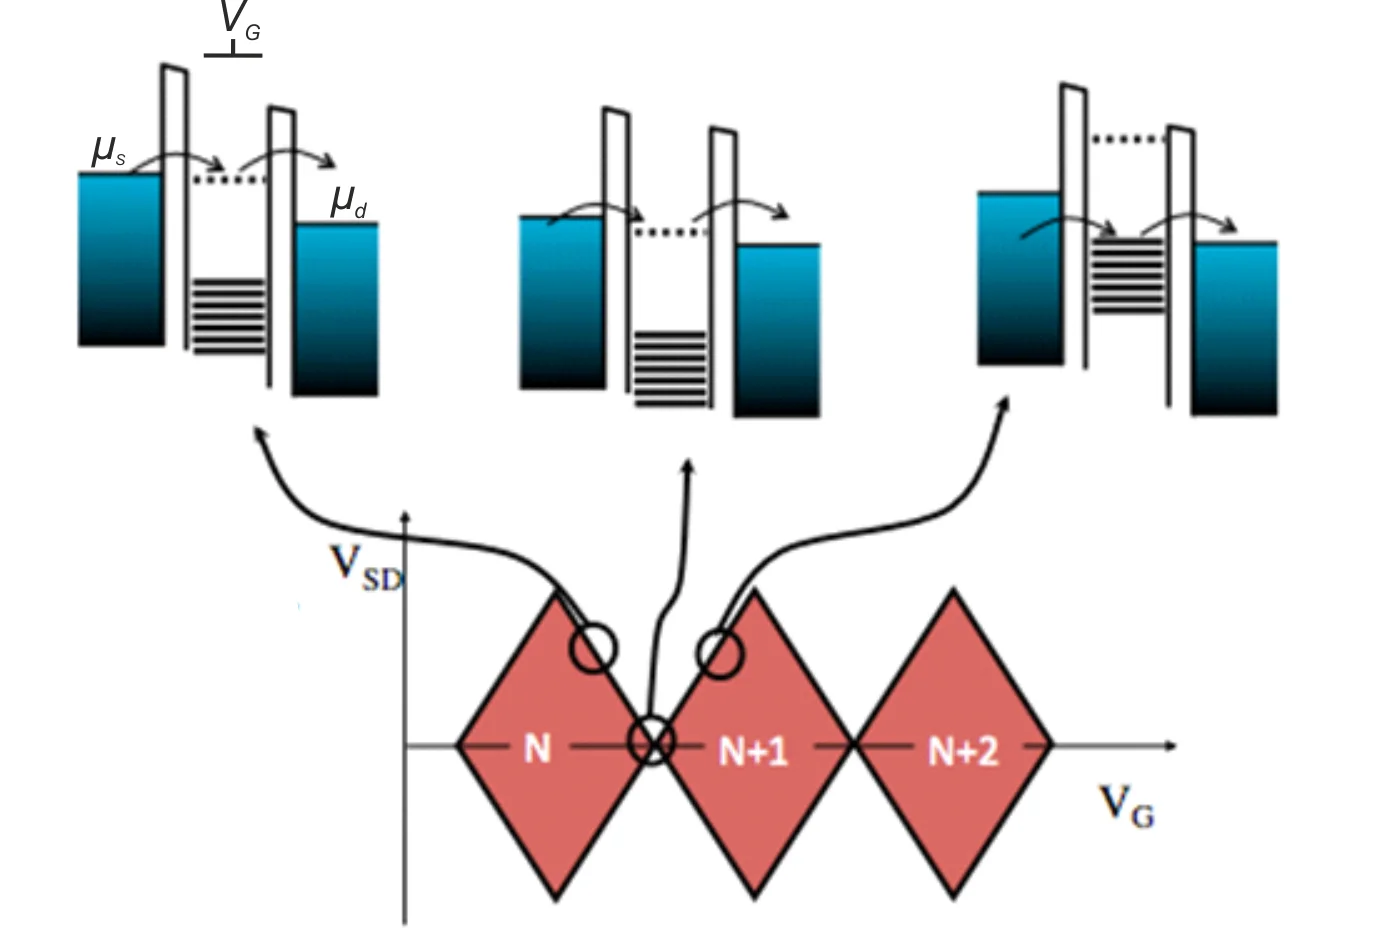
In 1998 Loss and DiVincenzo proposed to use the spin of confined electrons for the realization of a spin qubit [1]. Such spin qubits can be hosted in semiconductor nanostructures, known as quantum dots (QDs), and are typically studied at millikelvin temperatures. Coupling a QD to source and drain electrodes allows us to address the electronic properties of a QD by low-temperature electrical transport measurements making use of the phenomenon called Coulomb blockade (illustrated in Figure 1). At low temperature, current through the QD is generally blocked, since no electrochemical potential of the QD (dashed lines in Figure 1) lies inside the energy window defined by the source-drain voltage VSD = (μd - μs)/e. Electrical transport can be activated by bringing the electrochemical potential of a QD level in between μs and μd, either by changing the gate voltage VG or by making the source-drain bias window larger. By changing the gate and the bias voltage one can map out the stability diagram of a QD which assumes the shape of a series of diamond-shaped regions, the Coulomb diamonds, as shown in Figure 1. More information about spin qubits can be found in [2].
Measurement Techniques
A standard measurement method for obtaining such a diamond plot is the direct current measurement. It is prone to low-frequency 1/f noise and the bandwidth is small because of the strong low-pass filtering necessary for achieving a low effective temperature of the electrons in the sample.
A different measurement technique has emerged in recent years, the so called RF reflectometry technique. The idea behind this method is to sense indirectly the impedance change of a QD by monitoring the amplitude and/or the phase of an RF wave reflected from a QD. It is usually implemented using high-frequency lock-in techniques and is not prone to 1/f and other types of low-frequency noise, enabling thus higher bandwidth and consequently higher measurement speed.

The reflectometry technique relies on the electromagnetic wave principle: if a wave travels in a medium with characteristic impedance \(Z_0\) (e.g. coaxial cable) and it encounters a change of impedance from \(Z_0\) to \(Z\) (e.g. at the end of coaxial cable), a portion of the wave will be reflected back according to the expression \(A_r = A_{in} \times \Gamma\), where \(\Gamma = \frac{Z-Z_0}{Z+Z_0}\) is the reflection coefficient, \(A_r\) is the amplitude of the reflected wave, and \(A_{in}\) the amplitude of the incoming wave. By using this principle on a resonant circuit consisting of a tank circuit connected to a QD (Figure 2), one can obtain information about the QD from measuring the amplitude of the reflected wave. The elements of the resonant circuit, the inductance \(L\) and the capacitance \(C\) need to be chosen such that, at the resonant frequency \(f_0=\frac{1}{\sqrt{LC}}\) of the circuit, the matching condition is achieved. The matching condition is achieved when the typically large resistance (~100 kΩ) of the QD device is transformed to near \(Z_0\) = 50 Ω. The wave reflection coefficient \(\Gamma\) is then minimized. In that case the sensitivity is maximized [3], and small changes in the QD impedance result in an observable change in the reflected wave amplitude.
Measurement Setup and Results
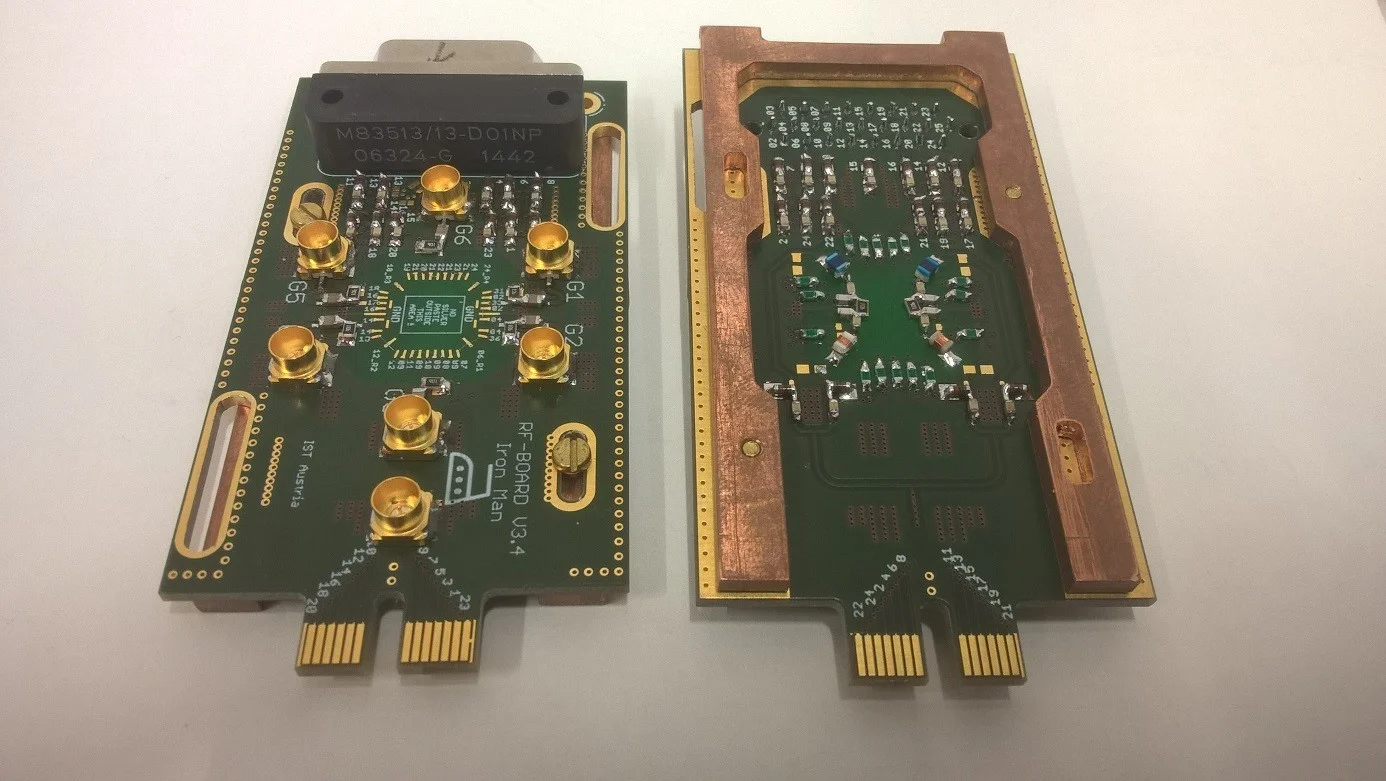
The sample is a SiGe/Si p-FET transistor fabricated at the LETI facilities in Grenoble, France [4]. At low temperature it behaves like a QD. It is mounted on the printed circuit board (PCB) sample holder shown in Figure 3. The sample holder is mounted to the mixing chamber plate of the dilution refrigerator with a base temperature of ∼30 mK. The LC tank circuit is soldered directly on the PCB. Both DC and RF signals are routed to the PCB bonding pads and then connected to the QD sample using the wedge wire bonding technique.
One PCB carries four tank circuits with different inductors, enabling measurements at four different resonant frequencies. In order to determine the resonant frequencies, we need to measure the reflection coefficient of the resonant circuits as a function of frequency.
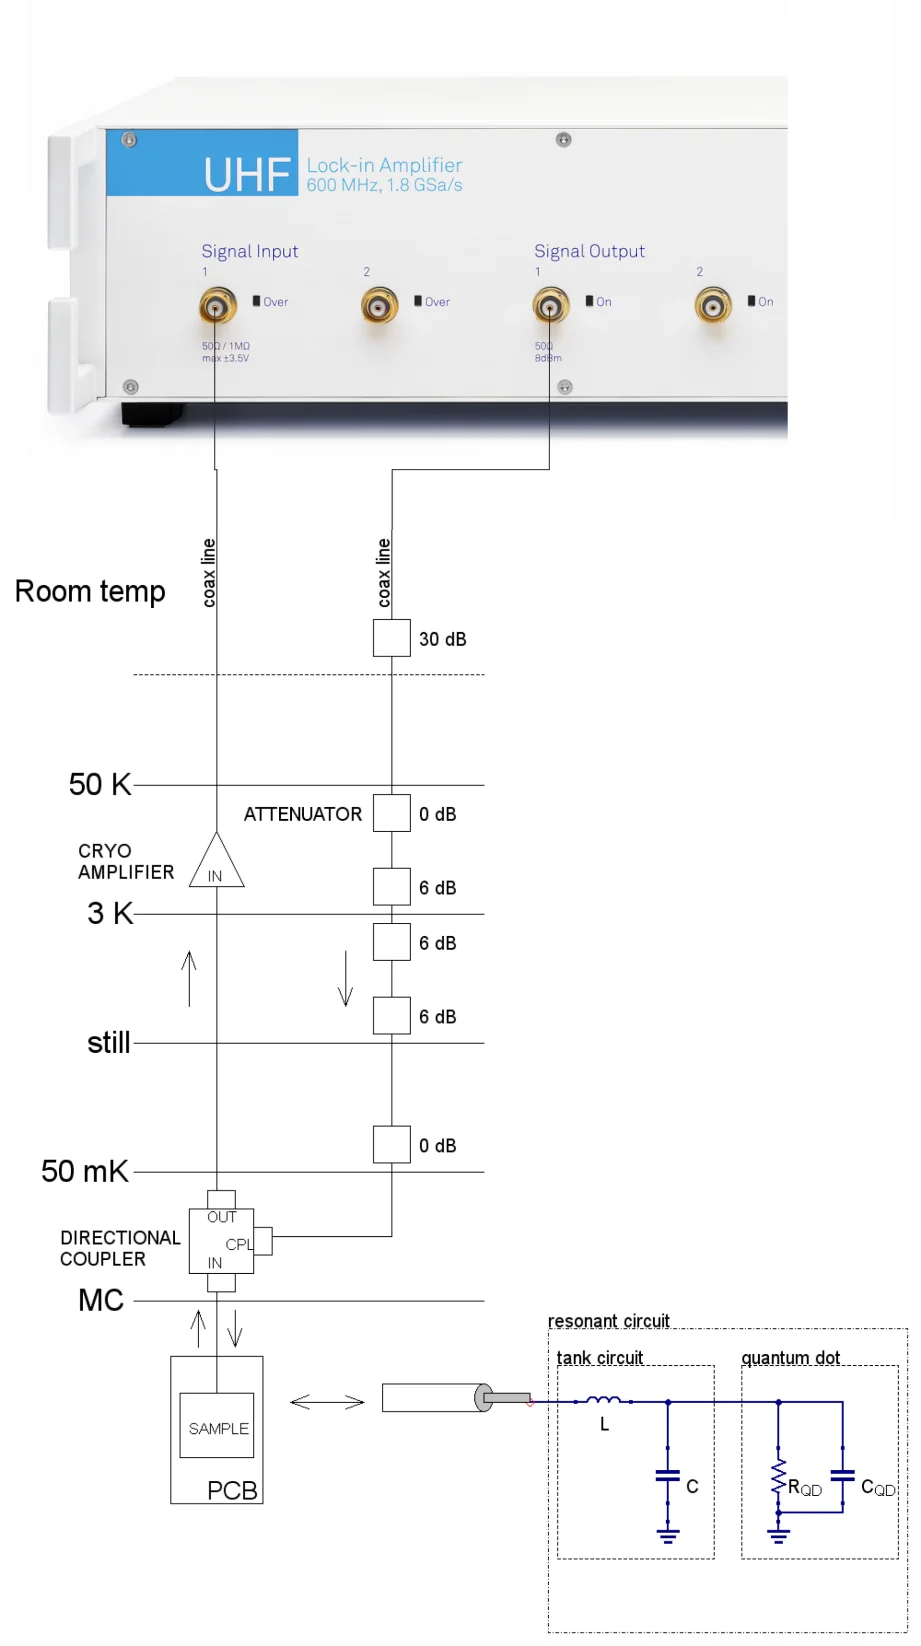
Figure 4 shows the electrical measurement setup including a directional coupler to enable the reflection coefficient measurement with the UHFLI. The DC part of the setup is not shown for simplicity. The sine signal generated using one of the UHFLI oscillators was sent down the dilution refrigerator to the directional coupler coupled port and swept using the LabOne Sweeper. The reflection signal was read out by the UHFLI’s input, demodulated to DC and filtered to suppress the noise. The measurement shown in Figure 5 reveals four resonances corresponding to the four LC tank circuits with different inductors.

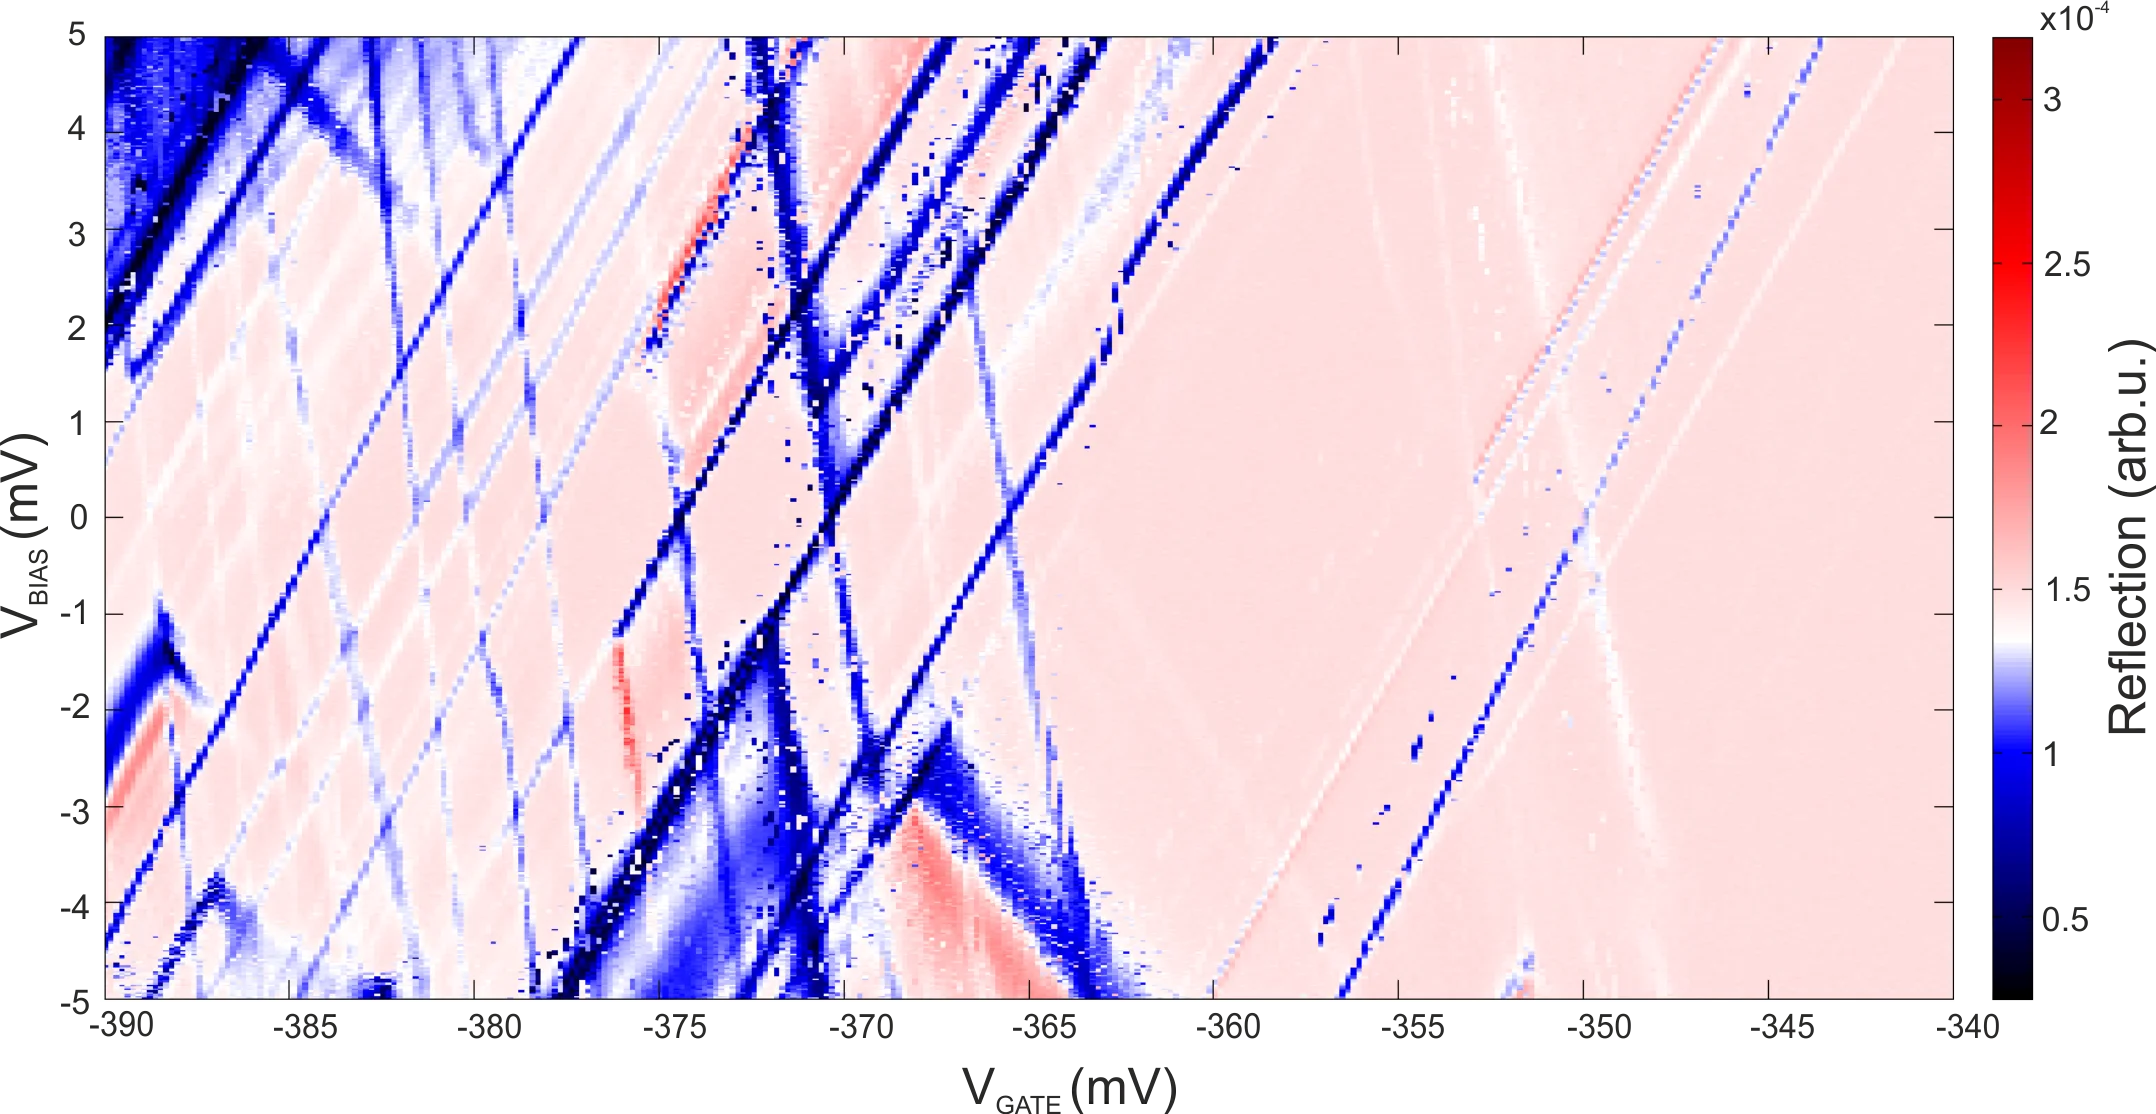
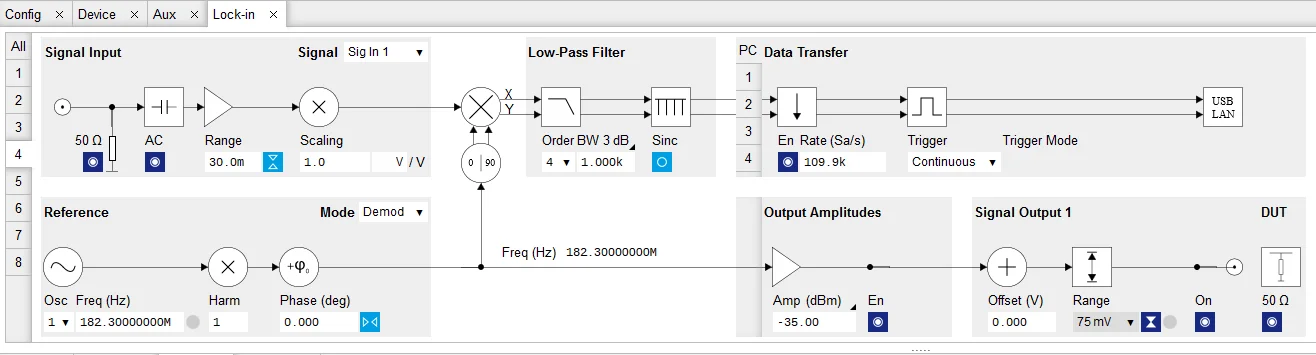
For recording the diamond plot of a QD as shown in Figure 6, the excitation sine signal frequency was set to the resonance frequency of the tank circuit to which the QD was connected. The electrical equivalent schematic of this configuration can be seen in Figure 2. The amplitude of the excitation signal reaching the QD needs to be very small in order not to heat up the electrons. For this reason and for getting a better signal-to-noise ratio on the output, a 30 dB attenuator was added at the output of the UHFLI. The UHFLI low-pass filter bandwidth of 1 kHz was chosen to achieve reasonably good signal-to-noise ratio. While measuring the reflection amplitude, the gate and source-drain bias voltages were swept. These two DC voltages were generated by custom-made DAC modules from TU Delft (see also here). The UHFLI parameters for recording the diamond plot in Figure 6 are shown in the graphical Lock-in tab display in Figure 7.
Future Directions
Here we focused on the ohmic reflectometry technique, where the LC tank circuit is connected to one of the metallic leads of the QD. When moving towards more complex devices with many gates (for example double QDs), gate reflectometry could be a more promising option. In gate reflectometry the LC tank circuit is connected to a gate electrode rather than the source or drain contact. In order to understand what is happening in the complex QD devices it is beneficial to be able to read out all gates at the same time, using the frequency multiplexing principle. This requires the generation and demodulation of multiple carrier signals at the same time, which can be achieved with the UHF-MF Multi-Frequency upgrade option.
References
- D. Loss, D.P. DiVincenzo, Physical Review A 57, 120 (1998).
- R. Hanson et al., Reviews of Modern Physics 79, 1217 (2007).
- N. Ares et al., Physical Review Applied 5, 034011 (2016).
- S. Barraud et al., IEEE TRANSACTIONS ON ELECTRON DEVICES 61, 953 (2014).