HF2LI Graphical User Interface
ziControl was the first graphical user interface for the HF2LI Lock-in Amplifier, designed with the aim to simplify the users' laboratory setups by combining the instruments with powerful analysis tools. ziControl includes:
- 2 high-frequency measurement units
- 2 high-frequency multi-sine signal generators
- 1 high-resolution Frequency Response Analyzer
- 1 high-resolution FFT Spectrum Analyzer
- 1 high-resolution 14-bit Oscilloscope with 2048 samples
- 1 time-domain Spectroscope
Key Features
- Intuitive and accessible graphical user interface
- Integrated oscilloscope, spectroscope, and frequency response analyser
- Simultaneous instrument access by multiple programs
- Control of local and remote instruments
- Control of up to 16 instruments from one graphical user interface
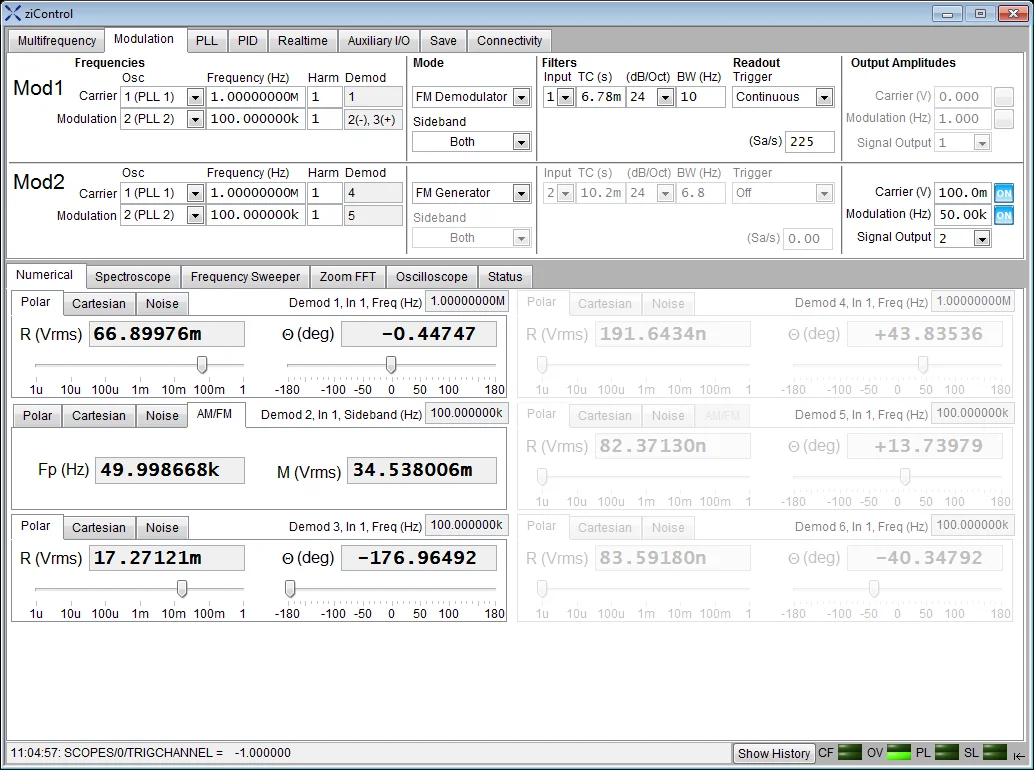
Numerical Tool
The Numerical tool provides an overview of the active demodulators of your instrument. The tool is especially useful when setting up an experiment. The numerical indicators immediately reveal the range of the demodulator results, the current precision of the results, and a logarithmic range for both polar (R, Theta) and cartesian (X, Y) representations.

Oscilloscope Tool
The Oscilloscope tool provides a handy graphical representation of what occurrs at the inputs and the outputs of the instrument. This means that it becomes unnecessary to install a physical oscilloscope on the test bench for this purpose. The built-in oscilloscope features all of the common scope controls such as run/single, trigger selection, trigger level, time scale, hold off, an FFT view, and a harmonic analysis of the measured signal.
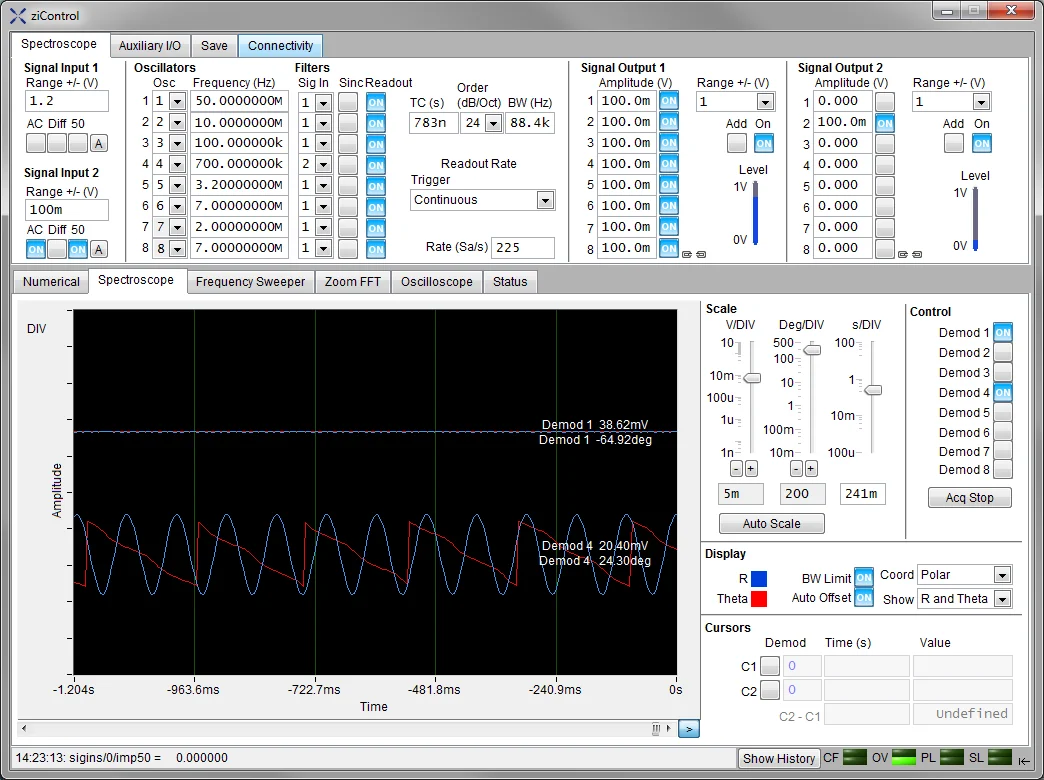
Spectroscope Tool
The Spectroscope tool represents the demodulator results as a function of time. It features a very wide range of scaling for both time and signal values, making it possible to monitor major as well as minor events. Flexible scaling and cursor function are also included. This tool is particularly useful for differentiating between the steady state of a measurement and the events for which an impedance change is detected. Saving functions for data and instrument settings are also available.
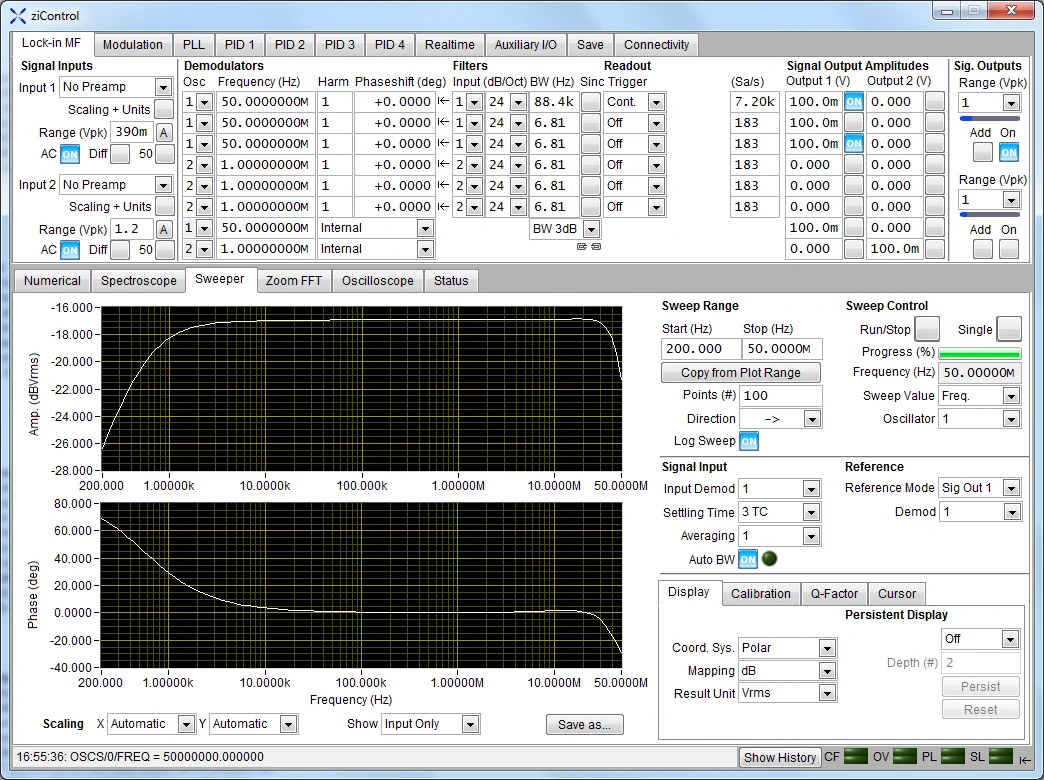
Frequency Response Analyzer / Sweeper Tool
The Frequency Response Analyser is a powerful high-precision measurement tool that is unique for this type of product. For instance, the frequency step is configurable to very small values. The built-in Frequency Response Analyzer also features all the common controls such as run/single, precision and filter settings, and many features that simplify the daily life of the user.
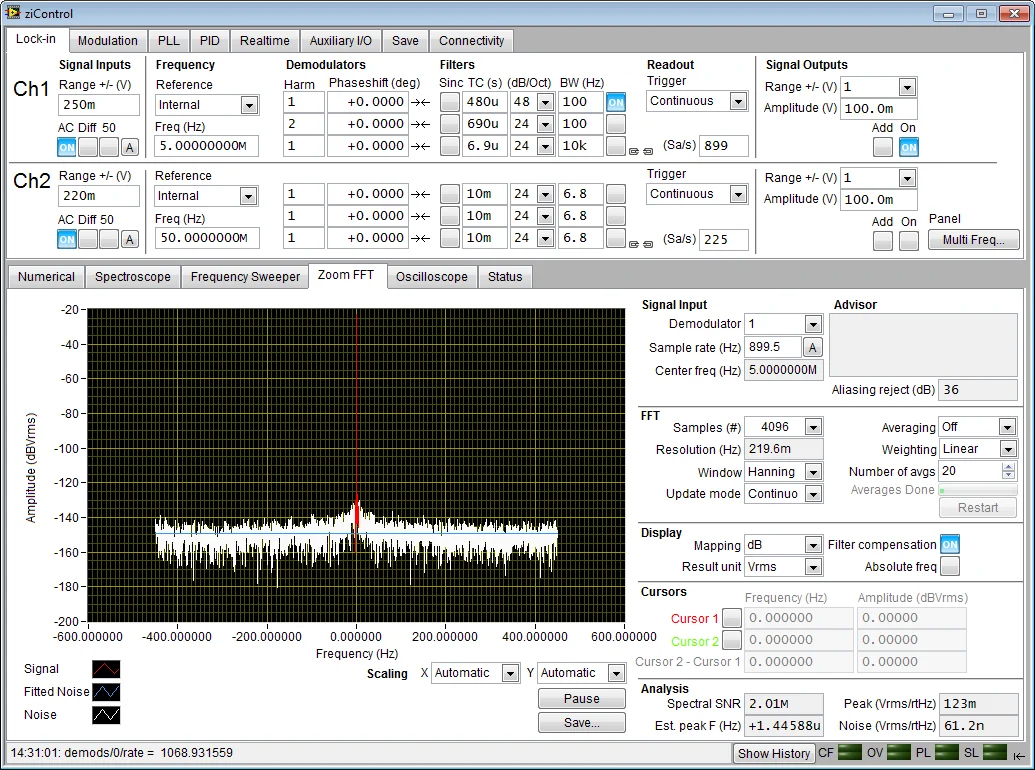
FFT Spectrum Analyzer / Zoom FFT Tool
The HF2 FFT Spectrum Analyzer is fully integrated inside the ziControl graphical user interface. It builds on a technique also called Zoom FFT, which is the numerical calculation of the FFT spectrum on samples demodulated by a lock-in amplifier. It delivers an extremely high-resolution output compared to an FFT performed on raw data before demodulation, as the resolution of an FFT spectrum is determined only by the total length of time spanned by the samples.
ziAPI
- LabVIEW (min version 2009) support
- Binary interface with C, C++ bindings
- MATLAB support
- Python support
- High-speed operation: 1 million demodulated samples per second
The ziAPI Application Programming Interface provides 5 programming interfaces to the HF2LI. The dedicated binary APIs for LabVIEW, C, and C++ provide extra support for the efficient integration of instruments into laboratory setups. More than 30 MByte of data per second can be processed, corresponding to more than 1 million demodulated samples per second.
ziServer
- Multi-instrument support
- Unlimited client support
- Powerful text-based programming interface
- High-speed operation: 30 MByte of data per second
- Support for remote client access over TCP/IP
The ziServer detects the instrument, provides configuration, and generates an overview for the user. It also provides a text-based interface that supports manual use and allows for integration with virtually any programming language. A powerful framework synchronizes settings amongst multiple instruments and clients connected to the server.